
How can i compare trusted filtration technologies for commercial water units?—Rocurement For Facilities
If you searched how can i compare trusted filtration technologies for commercial water units?, you’re facing a practical decision that combines operational risk, regulatory compliance, and cost control. Commercial water systems power kitchens, cooling towers, labs, manufacturing processes, and building services — choosing the wrong filtration technology or vendor can lead to downtime, higher operating cost, or even regulatory trouble. This article explains, in operational terms, how to compare trusted filtration technologies for commercial water units: what tests and metrics matter, the real-world strengths and limits of common technologies, how to size and stress-test a candidate solution, procurement and contract clauses that protect you, and a practical decision matrix you can apply today. I also point you to a representative whole-house/commercial unit you can use as a comparison baseline: https://yourwatergood.com/product/whole-house-water-filtration-system-for-home/.
Read straight through or skip to the sections you need — by the end you’ll be able to evaluate proposals using consistent, defensible criteria and select the technology best matched to your water, process sensitivity, and budget.
1. Start with data: testing that lets you compare technologies objectively
Comparison without a water test is guesswork. For commercial systems, request both source and endpoint testing (incoming feed and the critical downstream tap or process).
Minimum lab panel for commercial decision-making:
- General chemistry: pH, TDS, conductivity, alkalinity.
- Hardness: calcium and magnesium (mg/L or gpg).
- Major ions: chloride, sulfate, nitrate/nitrite.
- Metals: iron, manganese, lead, copper, arsenic if local risk exists.
- Organics: VOC screen, TOC (total organic carbon) where process quality or fouling risk exists.
- Disinfection residuals: free chlorine and chloramines (important for carbon/RO planning).
- Turbidity and TSS: key for prefiltration and membrane selection.
- Microbial: total coliform/E. coli for well sources or biological risk.
- Emerging contaminants: PFAS/PFOS and other local contaminants if flagged by regulators or site history.
Action: Put the full lab report in every RFQ. Demand vendors size their systems and provide performance expectations against your exact matrix. Vendors that generalize or refuse to use your water data are not trustworthy.
2. The decision frame: what “trusted” means in practice
When you compare technologies, interpret “trusted” as a set of measurable attributes:
- Proven performance: documented removal rates or operating experience in similar feedwater.
- Certifications or third-party test data: NSF/ANSI for specific contaminant classes or accredited lab results for industrial claims.
- Maintainability & field serviceability: how easy is maintenance, and is local service available?
- Supply-chain reliability for consumables: lead-time and alternative sources for membranes, media, cartridges.
- Operational risk profile: failure modes, downtime impacts, and how failures are detected.
- Total cost of ownership (TCO): not only capex but power use, water waste (RO reject), consumables, and labor.
- Regulatory compliance footprint: discharge permits, cross-connection/backflow control requirements, and health codes.
Use these attributes as the columns in your comparison matrix.
3. Technology primer — strengths, limits, and where each is trusted
Below are the key commercial filtration technologies and how to evaluate them for trustworthiness.
3.1 Sediment filtration (depth and pleated cartridges; backwashing media)
What it does: removes suspended solids, sand, rust and turbidity; protects downstream stages.
Trusted for: protecting membranes, preventing pump/nozzle clogging, reducing turbidity before disinfection.
Limitations: does not remove dissolved contaminants or disinfect. Cartridge life depends heavily on turbidity spikes.
How to compare vendors: rated micron size vs tested turbidity, rated gallons to clog, ΔP curve across flow range, availability of backwash option for continuous systems. For high-silt feeds, prefer backwashing multi-media or sand filters; for moderate loads, pleated cartridges with high surface area.
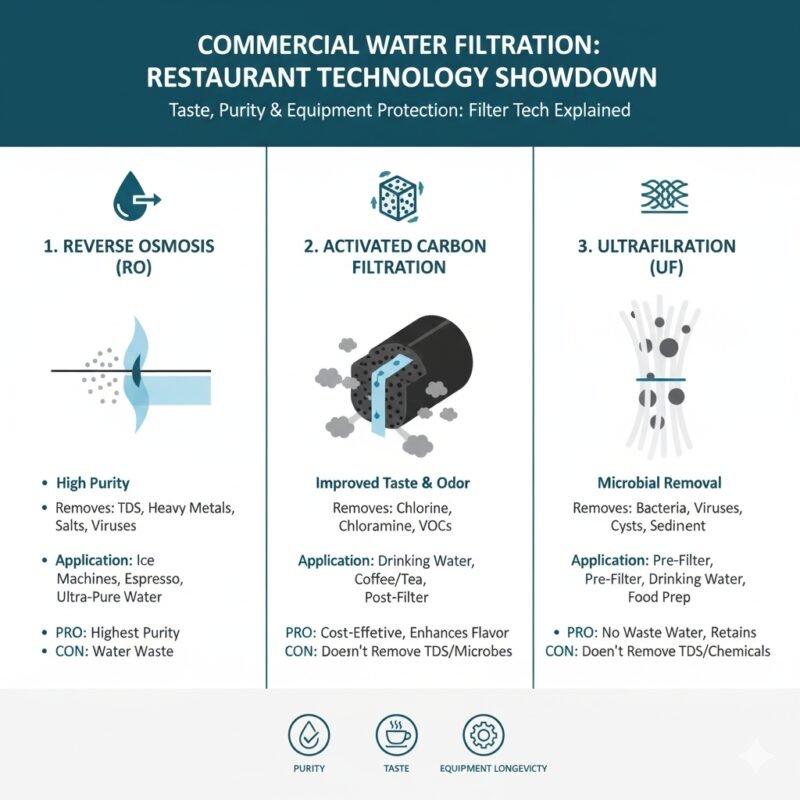
3.2 Activated carbon (GAC and carbon block; catalytic carbon for chloramines)
What it does: adsorbs chlorine, taste/odor, many VOCs, some organics and some PFAS (short-chain capture varies).
Trusted for: improving aesthetics, protecting downstream membranes, and for many organics when properly sized. Catalytic carbon is trusted for chloramine removal.
Limitations: finite capacity (breakthrough risk), can support bacterial growth if stagnant, PFAS removal depends strongly on bed depth/contact time and specific PFAS species.
How to compare vendors: bed volume (L or ft³), contact time at rated flow, breakthrough curves for target analytes, replacement schedule in gallons & time, and evidence of field installations with similar feed concentrations.
3.3 Ion-exchange softening (salt-based) and specialty resins
What it does: removes calcium and magnesium hardness (scale control), can be tailored for specific ions via specialty resins (e.g., nitrate removal).
Trusted for: boiler protection, reducing scale on heat exchangers and domestic hot water. Salt-based softening is proven.
Limitations: brine discharge, water chemistry changes (added sodium), resin fouling from iron/organics, need for regular regeneration.
How to compare vendors: grain capacity, regen frequency and salt use (lbs/regen), valve reliability, resin replacement lifespan, and options for high-efficiency or low-brine systems.
3.4 Reverse osmosis (RO) — membrane desalination
What it does: removes dissolved salts, most organics, many PFAS, nitrates, and reduces TDS — produces low TDS permeate.
Trusted for: high-purity water needs (boiler makeup, beverage & food production, laboratory water when paired with polishing), PFAS reduction when combined with pre/post treatment.
Limitations: requires robust pretreatment (sediment, carbon) to avoid membrane fouling, produces reject/waste stream, higher energy and maintenance costs. Membranes are sensitive to chlorine and fouling.
How to compare vendors: membrane type and brand, element flux and recovery rates at your feed conditions, expected membrane life under your TDS/turbidity, institutional references, and strategies for reject management and recovery optimization.
3.5 Ultrafiltration (UF) and microfiltration (MF)
What it does: removes colloids, bacteria, cysts, and larger organics; good microbial barrier. UF does not remove dissolved salts.
Trusted for: microbiological control where turbidity is low, as RO pretreatment, and for process protection requiring particle-free feed.
Limitations: fouling risk with high organics/turbidity; requires periodic backwash or clean-in-place; not a substitute for RO when dissolved ions are the issue.
How to compare vendors: pore-size rating, transmembrane flux under expected feed turbidity, clean-in-place protocols, and membrane material compatibility with your cleaning chemicals.
3.6 Adsorptive specialty media / ion-exchange for PFAS, arsenic, nitrate
What it does: targeted capture for trace contaminants using tailored adsorbents or anion exchange resins.
Trusted for: applications where specific contaminants are the risk and full RO is undesirable. Some media target PFAS effectively when appropriately sized.
Limitations: capacity-limited; performance sensitive to competing ions; regeneration/disposal considerations. PFAS media behavior varies by chain length.
How to compare vendors: capacity in grams per kilogram at your measured influent concentration, breakthrough curves with competing ions present, regeneration method and waste handling, and third-party validation on the species detected.
3.7 UV disinfection and advanced oxidation
What it does: UV inactivates microbes; AOP (advanced oxidation processes) using UV + peroxide/ozone can degrade some organics.
Trusted for: microbial control and supplemental organics destruction for feed to other stages. UV is trusted for validated microbial inactivation when turbidity is controlled.
Limitations: no removal of particulates or dissolved ions; lamp aging and sleeve fouling reduce performance; AOP needs precise control.
How to compare vendors: validated dose curves (mJ/cm²) for target organisms, hydraulic design to avoid shadowing, maintenance interval for lamp replacement and sleeve cleaning, and monitoring features.
4. Performance metrics that let you compare technologies fairly
When comparing vendors, insist on the following measurable metrics — not sales language.
- Percent removal at specified challenge conditions (e.g., 99% removal of 5 mg/L chlorine at 10 GPM). Ask for test protocol.
- Rated service flow (GPM) at specified ΔP — compare curves across the full expected flow range, not just a single point.
- Capacity in gallons or bed volumes — convert to calendar life using your average daily throughput.
- Breakthrough curve data — for adsorptive media and carbon, get concentration vs treated volume curves for your matrix.
- Fouling and cleaning schedules — for membranes and UF, get expected cleaning frequency and procedures.
- Energy demand (kW) and ancillary pumps — include blower/boost pumps for RO or backwash pumps in TCO.
- Waste streams and volumes — RO reject ratio, softener brine volumes, backwash discharges — check local discharge limits.
- Monitoring features — presence of online TDS probes, pressure differential alarms, remote telemetry. These reduce risk and make a technology more “trusted” in practice.
If a vendor cannot provide these numbers for your feed matrix, downgrade their trust score.
5. Size and stress-test candidate systems — practical calculations
Sizing is critical. Use the lab results to compute demand and stress the proposed design:
- Calculate daily and peak flow needs: daily process demand (gpd) and the peak GPM scenario (simultaneous draws or continuous process).
- Convert vendor capacity to calendar life: e.g., a carbon bed rated for 200,000 gallons will treat 5,000 gpd for 40 days — but contact time and contaminant loading must be considered.
- Estimate downtime impact: what happens if a membrane fails or a media bed is exhausted? Evaluate redundancy (parallel trains, duplex softeners, spare membrane stock).
- Compute waste streams: an RO with 50% recovery producing 5,000 gpd permeate will reject another 5,000 gpd — can your site discharge or reuse that water? Include cost of wastewater disposal or treatment.
- Model fouling scenarios: convert TOC and turbidity into expected membrane fouling rates using vendor fouling factor guidance; ask for a worst-case cleaning frequency quote.
Require vendors to run these calculations using your water report; request written assumptions and sensitivity runs (e.g., what if turbidity doubles).
6. Operational reliability: control, monitoring, and failure modes
A technology is only as trusted as its support systems.
- Online sensors: TDS/conductivity, pressure differentials, turbidity meters, and chlorine sensors allow early detection of failure or exhaustion. Compare vendors on sensor availability and integration with plant control systems.
- Alarms and telemetry: remote alerting reduces downtime and mean-time-to-repair (MTTR). Prefer vendors that include standard telemetry or open-API SCADA hooks.
- Redundancy & serviceability: hot-swappable cartridges, parallel membrane racks, or duplex softeners allow maintenance without process interruption. Evaluate mechanical simplicity for rapid field service.
- Spare parts policy: guaranteed local stock or guaranteed shipping time for critical consumables and replaceable parts.
- Training & documentation: complete O&M manuals, training sessions for your operators, and troubleshooting guides.
Trust is built when the system tells you it’s failing before it stops working.
7. Procurement language to protect facility owners
Ask your procurement/legal teams to include these clauses to ensure vendor accountability.
- Performance acceptance tests (PAT): require pre/post lab verification and a measured run-in period (e.g., 30 days) where vendor demonstrates performance under load. Tie acceptance to passing test results.
- Warranties & uptime SLAs: specify parts and labor warranty periods and a guaranteed response time for emergency on-site support.
- Consumable pricing transparency: require fixed pricing or capped inflation for cartridges/membranes for an initial period (1–3 years), plus lead-time guarantees.
- Spare-part kit and stocking requirement: vendor supplies an initial spare kit and commits to local stocking or overnight shipping.
- Performance bonds or holdback: hold back a portion of payment until commissioning tests pass.
- Data & telemetry access: require the vendor to provide monitoring data and alarms to your facility or a neutral platform.
- Termination & remediation: define remediation milestones if the system fails to meet agreed performance and a path to replacement by the vendor if remediation fails.
These clauses turn performance promises into enforceable contractual obligations.
8. Comparative scoring matrix — a practical tool
Create a scoring matrix with rows for vendors/technologies and columns for the objective attributes below. Score 0–10 and weigh columns based on importance to your operation.
Columns to include:
- Verified removal for target contaminants (evidence quality).
- Rated flow & pressure performance vs peak need.
- Consumable life and cost (TCO weight).
- Energy & water waste (RO reject) impact.
- Maintenance frequency & operator labor.
- Redundancy & downtime handling.
- Local service & spare parts availability.
- Monitoring & remote telemetry features.
- Environmental/regulatory fit (discharge & permits).
- Capital cost & 5-year TCO.
Sum weighted scores and use sensitivity analysis — change the weight of water efficiency vs capital cost and see how rankings shift.
9. Field validation — pilot tests and references
Never accept a single factory spec as final proof. Do one or more of these:
- Pilot skid: rent or lease a pilot skid to run on your feedwater for a month. This reveals fouling, cleaning frequency, and actual performance.
- Reference site visits: visit a similar facility and inspect a system after months of service. Ask about failures and undocumented costs.
- Third-party review: contract an independent water engineer to review vendor calculations, perform a site survey, and witness commissioning tests.
Pilots are the single best investment to avoid an expensive wrong decision.
10. Final decision checklist and next steps
- Order a full lab report (source & critical endpoint).
- Create an RFQ with your acceptance criteria, peak flows, and desired SLAs; attach the lab report.
- Request vendor proposals with modeled performance against your feedwater, itemized costs, and references.
- Score each proposal using the matrix above and run a 3–5 year TCO.
- Require a pilot or at least a site visit to an existing install in similar conditions.
- Include PATs, telemetry requirements, spare kits, and consumable lead-time guarantees in the contract.
- Negotiate pricing or conditional purchase terms (holdback until PAT success).
- Plan the maintenance schedule and train operators before start date; ensure remote alerts are connected.
Closing — trust is engineered, not advertised
Comparing trusted filtration technologies for commercial water units means moving from marketing claims to measurable, site-specific evidence. Start with the water analysis, demand vendor data against your feedwater, stress-test capacity and waste streams, require monitoring and redundancy, and lock performance into contracts. Technologies like RO, UF, carbon, and ion exchange are all trusted when correctly matched to the problem, properly sized, and supported by monitoring and an operator-ready maintenance plan. Use the comparison and contractual tools above to make that match consistently — and use a representative product spec such as the one at https://yourwatergood.com/product/whole-house-water-filtration-system-for-home/ as a baseline when soliciting vendor quotes.