Water Quality Monitoring System for AI Data Center Cooling: Sensors, Setpoints and Predictive Maintenance

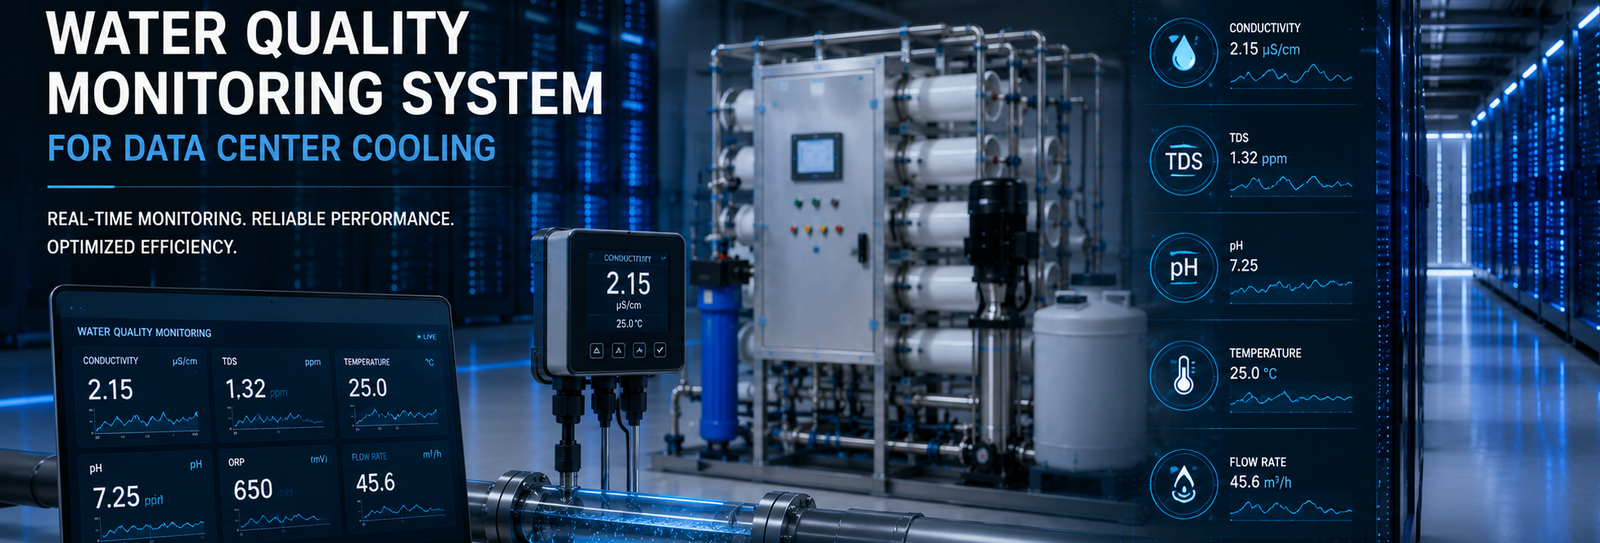
Before evaluating any vendor for a water quality monitoring system for data center cooling, lock down these non-negotiables:
- Continuous online TDS/conductivity readings at RO inlet and permeate — not weekly grab samples sent to a lab
- Differential pressure (PSI) transmitters across every pretreatment stage, not just a single gauge at the RO skid
- Flow verification in GPM at makeup, permeate, and reject lines, tied directly to an automated backwash trigger
- Alarm and data-logging architecture that can hand off to a facility BMS or, at minimum, run a standalone PLC-HMI historian
- Modular flow range — a 4.4–44 GPM (1–10 t/h) skid platform that scales with rack density without a re-engineering cycle
None of these are optional on a site carrying six- or seven-figure GPU assets per row. A scale event or a fouled cartridge that goes unnoticed for even a shift can put a cooling loop into an uncontrolled excursion.
Fast Check Product: https://yourwatergood.com/product/industrial-reverse-osmosis-system/
Why Monitoring Is a Cluster-Protection Function, Not a Water-Quality Afterthought
Facility teams tend to file water treatment under plumbing. On a high-density AI cluster, that’s a miscategorization.
A water quality monitoring system for data center cooling</a> exists to catch four failure modes before they touch the compute layer:
- Scale formation on heat exchanger surfaces and cold plate microchannels, driven by hardness and silica concentrating as cycles increase
- Membrane and cartridge fouling, which shows up first as a rising PSI differential, long before permeate quality visibly degrades
- Corrosion, accelerated by chloride and sulfate ions attacking aluminum cold plates and copper manifolds
- Biofilm growth, which raises thermal resistance at the exact surfaces GPUs depend on to reject heat
Each of these ends the same way operationally: reduced heat transfer, rising coolant supply temperature, and — past a threshold — thermal throttling or a forced load shed across the row. A monitoring system’s job is to surface the leading indicator (conductivity drift, PSI climb, flow decay) days or weeks before the lagging indicator (a hot spot alarm on the rack itself) ever fires.
Request a Data Center Water Sizing Consultation if you’re scoping a monitoring retrofit against an existing cooling loop rather than a new build — the sensor placement strategy differs materially between the two.
The Sensor Stack: From Multimedia Filtration to RO Permeate
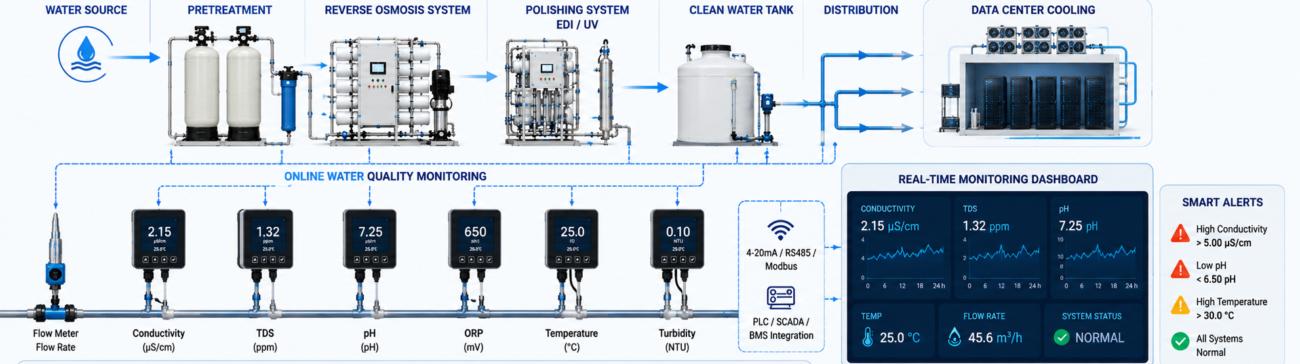
A monitoring architecture is only as good as the treatment train it’s watching. On a five-stage industrial RO platform sized for data center makeup water, the instrumentation typically maps like this:
- Multimedia filter — inlet/outlet PSI differential flags sediment loading before it reaches downstream media
- Activated carbon filter — outlet PSI and periodic chlorine residual checks protect the RO membrane from oxidative attack
- Ion-exchange softener — hardness breakthrough monitoring on the effluent side, timed to salt-box regeneration cycles
- Precision security filter — the last PSI checkpoint before the RO array; a fast-climbing differential here is usually the earliest fouling signal in the whole train
- RO membrane array — inlet, permeate, and reject conductivity/TDS, plus permeate flow, closing the loop on desalination performance
On a system built to this architecture, raw water running roughly 1,300 ppm TDS is documented coming down to under 20 ppm in single-stage configuration, and under 10 ppm with a two-stage pass. Capacity scales 4.4 to 44 GPM (1–10 t/h) in modular increments, with a minimum inlet pressure requirement of 29 PSI (0.2 MPa) — booster pumps are specified for sites that can’t guarantee that at the skid.
Real-time PSI differential and flow rate feedback are built into that platform as standard instrumentation, which is the baseline most facilities should be sizing against before adding anything custom.
Reading the Data: PSI Differential as a Predictive Maintenance Trigger
Conductivity tells you what left the system. PSI differential tells you what’s about to go wrong inside it — and it tells you earlier.
A cartridge or membrane in good condition holds a stable differential across a given flow rate. As fouling accumulates, that differential climbs before permeate TDS moves meaningfully, because early-stage fouling reduces flux uniformity long before it compromises rejection. Facilities running on reactive maintenance — waiting for a permeate quality alarm or a flow shortfall — are, by definition, responding after the fouling has already cost pump energy and accelerated media wear.
Predictive maintenance flips that sequence: trend the PSI differential per stage, set a rate-of-change alarm rather than only an absolute threshold, and schedule backwash or cartridge replacement against the trend line instead of a fixed calendar interval. On a system with automatic backwash and flush cycling already built in, the monitoring layer’s job is simply to decide when that cycle fires — on schedule, or early, based on what the differential is actually telling you.
The OPEX delta shows up in three places: fewer emergency service calls, longer membrane life from catching fouling before it compacts, and fewer full cartridge changeouts driven by guesswork instead of data.
Facility Water System vs. Technology Cooling System: Where Requirements Diverge
Not every gallon in a liquid-cooled data center needs the same water quality — and treating them identically is a common (and expensive) sizing mistake.
Facility Water System (FWS) loops — the makeup water feeding cooling towers, CDUs, and heat rejection equipment — generally run a pH band around 7–9, with hardness, chloride, sulfate, and turbidity limits set to control scale and general corrosion. This is the water a water quality monitoring system for data center cooling at the makeup point is primarily sized to control.
Technology Cooling System (TCS) loops — the closed circuits running directly to cold plates and CDU secondary loops — carry tighter chemistry. Industry guidance for these loops runs conductivity in the low tens of µS/cm and holds pH in a narrower band, because dissolved ionic content at the cold plate interface is a direct corrosion and dielectric-safety variable, not just a scaling concern.
Field engineering insight: cold plate microchannels on current-generation accelerators can run under 100 microns in width. At that geometry, silica and hardness don’t need much concentration factor to bridge a channel — a scaling trend that would be cosmetic on a cooling tower fill can be a flow-blocking event on a cold plate. The other detail worth knowing before you size a monitoring window: RO membrane flux drops with feed water temperature, so permeate flow at a fixed pressure in a 50°F winter feed will read lower than the same membrane’s summer output — a real capacity swing, not a fouling event, and monitoring thresholds should be seasonally adjusted to avoid false fouling alarms.
Standard Pre-Engineered Skids vs. Data Center–Grade High-Redundancy Systems
| Parameter | Standard Pre-Engineered Skid | Data Center–Grade High-Redundancy System |
|---|---|---|
| Flow control | Fixed GPM band, manual valve trim | Automated GPM trim across parallel trains |
| Redundancy | Single train (N); service requires downtime | N+1 or 2N parallel trains; hot-swap capable |
| BMS / SCADA integration | Local PLC + HMI, standalone alarms | PLC-to-BMS/SCADA handoff, remote alarm escalation, historian logging |
| Delivery lead time | Shorter — standard configuration | Longer — engineered-to-order for site redundancy |
| Filtration precision | 5-stage baseline (multimedia → carbon → softening → security filter → RO) | Same 5-stage baseline, duplexed critical components, tighter alarm bands |
Most facilities don’t need to over-buy redundancy on day one. The more common mistake is specifying a standard skid’s monitoring and control layer as if it already includes full SCADA/BMS integration — confirm that scope explicitly with your engineering team before it’s assumed into a construction schedule.
Scaling Monitoring Across a 4.4–44 GPM Modular Deployment
Hyperscale and colocation sites rarely size to a single fixed load. A modular platform sized 4.4–44 GPM (1–10 t/h) per skid lets a facility add parallel trains as rack density grows, rather than re-piping and re-instrumenting a monolithic unit.
For colocation environments specifically, this matters at the monitoring layer as much as the treatment layer: multi-tenant SLAs generally require water quality consistency to be provable, not assumed, which means the conductivity and PSI trend logs need to be auditable per train, not just at a single site-wide meter.
For a facility scoping a water quality monitoring system for data center cooling, the sizing conversation should start from projected GPM at full rack density, not current load — retrofitting instrumentation onto an under-sized skid later is a harder project than specifying headroom up front.
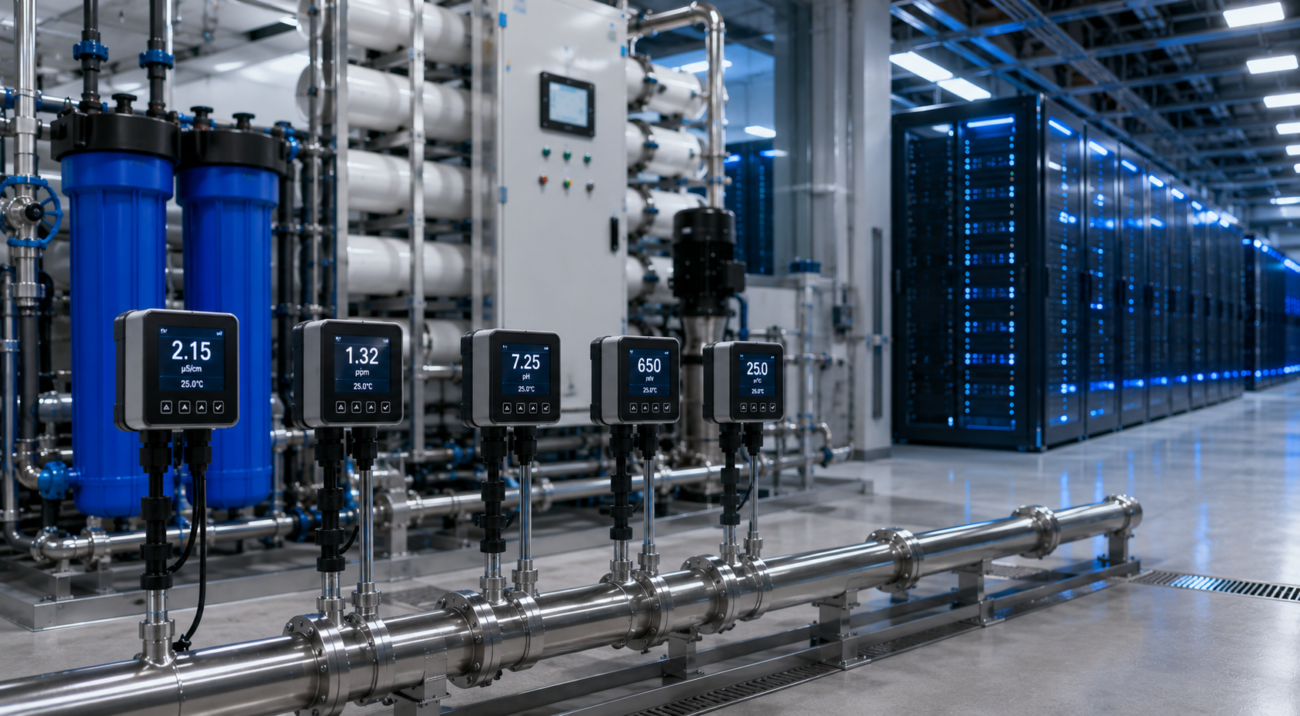
Request a Data Center Water Sizing Consultation to map your projected GPM, TDS target, and redundancy requirement against a modular skid configuration before your construction schedule locks the mechanical room footprint.
FAQ
What TDS level should data center cooling makeup water target? Facility water system makeup is commonly targeted well under 50 ppm TDS to control scale and support higher cooling tower cycles of concentration; a two-stage RO configuration on a 1,300 ppm raw water feed can bring that under 10 ppm.
How often should conductivity and PSI sensors be calibrated in a 24/7 facility? Quarterly calibration is a common baseline for critical-loop instrumentation, tightened to monthly during commissioning or after any pretreatment media change, since a drifted sensor reads as a false-negative fouling signal.
What’s the difference between FWS and TCS water quality requirements? FWS (facility water system) governs makeup water to cooling towers and CDUs with broader pH and hardness tolerances; TCS (technology cooling system) governs the closed loop to the cold plate itself, with a materially tighter conductivity band due to dielectric and corrosion sensitivity at the chip interface.
Can one skid monitor PSI and flow across multiple filtration stages simultaneously? Yes — a properly instrumented five-stage skid carries PSI differential and flow monitoring at each stage boundary as standard, not as an add-on, so multimedia, carbon, softening, and RO stages each report independently.
How does real-time monitoring reduce data center cooling OPEX? It shifts membrane and cartridge replacement from a fixed calendar to a condition-based trigger, reduces emergency service dispatches, and protects pump energy consumption that otherwise climbs as fouling increases flow resistance.
Does a standard RO skid include SCADA/BMS integration out of the box? Typically no — standard configurations ship with PLC and local HMI monitoring; full SCADA/BMS handoff and historian logging are usually scoped as part of a custom turnkey engineering package.
What capacity range covers a typical AI data center liquid cooling deployment? Modular platforms from 4.4 to 44 GPM (1–10 t/h) per skid cover single-row deployments up to multi-train hyperscale configurations, scaling by adding parallel trains rather than resizing a single unit.
Sizing a monitoring layer against a live construction schedule, or retrofitting instrumentation onto an existing cooling loop, both come down to the same three deliverables: an Infrastructure Engineering Quote, full Technical Data Sheets for your mechanical team, and B2B wholesale / factory-direct pricing for the skid and instrumentation package. Request all three before your mechanical room drawings freeze.