Online TDS and Conductivity Monitoring for Data Center Cooling Water: Sizing Notes for 24/7 GPU Uptime

Before a make-up water skid gets anywhere near a purchase order for a high-density GPU hall, lock these five items first:
- Continuous duty rating. The skid runs 24/7/365 against a live thermal load — not an 8-hour industrial cycle stretched to fit a data hall.
- Documented feed-to-permeate TDS reduction, not a bare rejection-percentage claim. A skid that takes 1,300 ppm raw water below 20 ppm single-pass, or below 10 ppm in a two-pass configuration, tells a facilities engineer far more than “99%+ rejection.”
- Onboard, continuous PSI differential and flow-rate monitoring — not a monthly grab-sample program run by a third-party lab.
- Automatic backwash and flush cycling on a schedule, so membrane performance doesn’t depend on an operator remembering to trigger it at 2 a.m.
- A stated feed-pressure floor. Most skids need at least 0.2 MPa (roughly 29 PSI) at the inlet; anything below that has to be quoted with a booster pump up front, not discovered during commissioning.
These aren’t abstract nice-to-haves. On a rack pulling 40–100+ kW, a slow drift in make-up water TDS is the kind of failure mode that doesn’t show up on a dashboard until it’s already scale on a cold plate.
Fast Check Product: https://yourwatergood.com/product/industrial-reverse-osmosis-system/
Why Real-Time Monitoring Is the First Warning Line, Not a Compliance Checkbox
Cooling water quality control on a legacy CRAH-based hall and cooling water quality control on a direct-to-chip or rear-door liquid-cooled hall are not the same discipline. Micro-channel cold plates and CDU heat exchangers have far less tolerance for particulate, hardness, and silica than a traditional chilled-water coil.
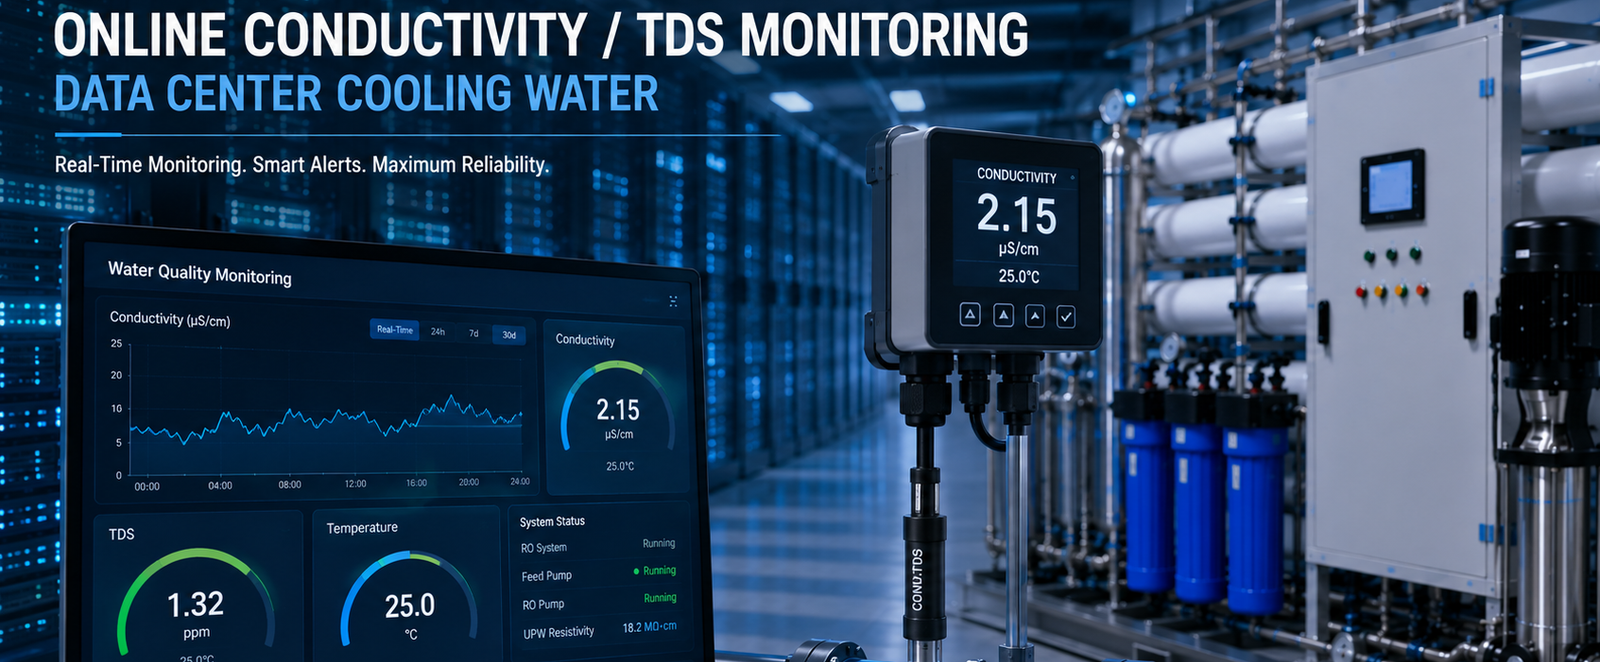
That’s the operating context behind <a href=”https://yourwatergood.com”>online TDS and conductivity monitoring for data center cooling water</a>: it’s not a regulatory line item, it’s the earliest possible indicator that something upstream — a softener resin bed, a carbon filter, a membrane seal — is starting to fail before it becomes a thermal event.
A conductivity probe reading a stable 15 ppm every day for six months and then drifting to 40 ppm over 72 hours is not a rounding error. In a facility with 40 kW+ racks, that drift is a maintenance ticket that should fire automatically, before it becomes a hot-spot investigation.
Request a Data Center Water Sizing Consultation
Where the Sensors Actually Belong: Feed-Side vs. Permeate-Side
Two monitoring points do two different jobs, and treating them as interchangeable is a common design mistake:
- Feed-side (pre-RO) conductivity/TDS monitoring tracks what the five-stage pretreatment train is handing off to the membranes — multimedia filtration, activated carbon, ion-exchange softening, and precision cartridge filtration. A rising feed-side reading usually means pretreatment breakthrough, not a membrane problem.
- Permeate-side (post-RO) conductivity/TDS monitoring tracks membrane integrity directly. This is the number that correlates with cold-plate and CDU loop water quality, and it’s the one that should carry the tighter alarm band.
A system built around a documented drop from 1,300 ppm feedwater to under 20 ppm in a single pass — or under 10 ppm with a two-stage configuration — gives an engineer a real baseline to alarm against, rather than a generic “high TDS” trip point borrowed from a boiler-feed spec sheet.
Reading the Drift: What a TDS/Conductivity Spike Is Actually Telling You
Three failure modes show up first as a conductivity or TDS number, well before they show up as a work order:
- Membrane fouling or scaling. Rising permeate-side TDS with stable feed-side readings points to declining rejection — often silica or residual hardness slipping through, especially if softener regeneration has drifted off schedule.
- O-ring or seal failure. A sudden step-change (not a gradual drift) in permeate conductivity is more consistent with a seal bypass than progressive fouling.
- Pretreatment breakthrough. Feed-side TDS climbing ahead of the RO stage — typically a softener resin bed reaching exhaustion between regeneration cycles, or carbon media reaching the end of its adsorption life.
None of these are diagnosed by an annual water analysis. They’re diagnosed by a trend line, which is the entire argument for continuous monitoring over periodic sampling on any loop feeding a mission-critical thermal system.
Field Insight: Why Micro-Channel Cold Plates Change the Math
Direct-to-chip cold plates commonly run internal channels under 100 microns. At that scale, silica and residual hardness that a conventional chilled-water loop would tolerate for years can build a restrictive layer inside a channel in a fraction of the time — and the failure signature isn’t a leak, it’s a slow rise in chip junction temperature that gets misread as a compute or firmware issue before anyone checks the water.
The other detail that rarely makes it into a spec sheet: RO membrane flux is temperature-dependent. A system sized and validated against summer feedwater temperatures will under-produce on cold intake water unless that temperature correction is built into the sizing, not the operating assumption. It’s a common gap between a skid’s rated GPD/GPM and what it actually delivers on a cold January feed.
Engineering the Loop: Five-Stage Pretreatment Feeding a Monitored RO Stage
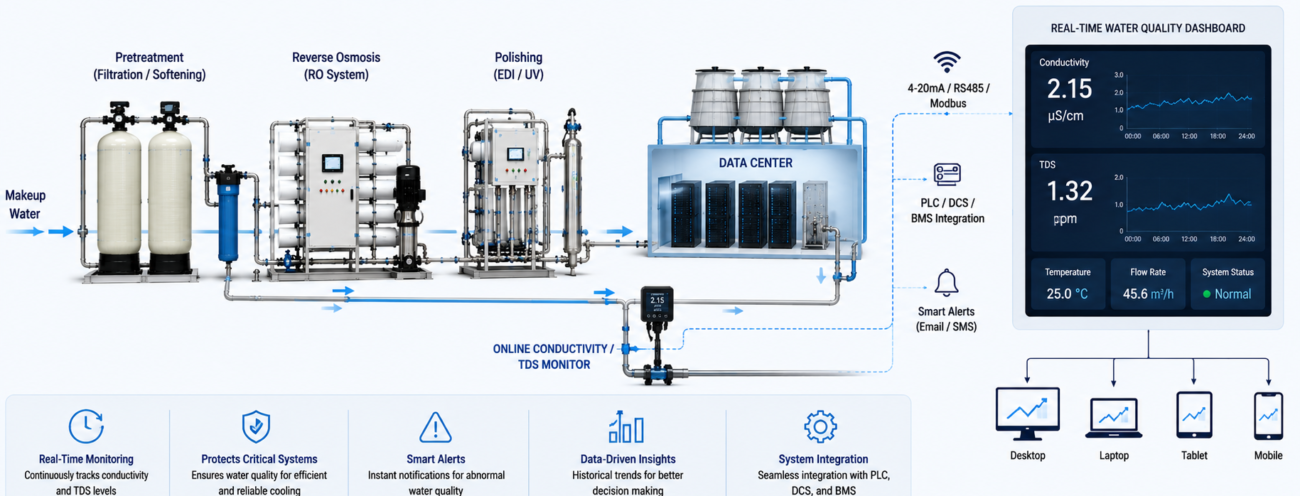
The monitoring layer only means something if the pretreatment it’s watching is doing real work. A five-stage architecture — multimedia filtration, activated carbon, ion-exchange softening with a dedicated brine tank, precision security filtration, and the RO membrane array — gives online monitoring something meaningful to alarm against at each stage boundary, rather than a single black-box TDS number at the end of the line.
Configurations in the 1–10 t/h range (roughly 4–44 GPM, or in the neighborhood of 6,000–63,000 GPD) cover most single-hall make-up water demand, and modular trains scale by adding parallel skids rather than re-engineering a single oversized unit — a relevant point for any facility planning phased build-out rather than a single day-one capacity number.
None of this replaces engineering judgment specific to a site’s water chemistry, ASHRAE TC9.9 liquid-cooling water quality targets, or a facility’s EPA discharge obligations for RO concentrate — those are site-specific evaluations, not defaults a skid ships with.
Standard Pre-Engineered Skid vs. Data-Center-Grade High-Redundancy System
Not every make-up water application needs the same architecture. The distinction matters at the RFP stage, before pricing gets compared apples-to-oranges:
| Parameter | Standard Pre-Engineered Skid | Data-Center-Grade High-Redundancy System |
|---|---|---|
| Flow rate | Single train, ~4–44 GPM (1–10 t/h) | Multiple trains arrayed in parallel for N+1 / N+2 capacity |
| Redundancy | None — single point of production | N+1 or 2N configuration, engineered per site load |
| Monitoring / control | Onboard PLC with real-time PSI and flow-rate readout | Same PLC-level monitoring as the baseline, with BMS/SCADA integration engineered on a per-project basis |
| Filtration precision | Five-stage: multimedia → carbon → ion-exchange softening → precision filter → RO | Same five-stage core, with single- vs. two-pass RO staging selected to hit sub-10 ppm targets |
| Typical fit | Single-hall or lower-density facility | Hyperscale, colocation, or any site where a skid outage cannot mean a cooling-water gap |
A standard skid with real-time monitoring is not automatically a data-center-grade system — the difference is redundancy and integration depth, engineered per site, not a default configuration.
Get Technical Data Sheets for Your Site
Sourcing Note: What to Actually Ask For
When comparing quotes for <a href=”https://yourwatergood.com/product/industrial-reverse-osmosis-system/”>online conductivity and TDS monitoring on data center cooling water</a> equipment, ask each vendor for the same three things, in this order: documented feed-to-permeate TDS reduction data (not a rejection percentage), the alarm architecture on both feed-side and permeate-side sensors, and whether N+1 redundancy is a re-engineered custom quote or an available standard configuration. Vendors who can’t answer the first question with numbers are quoting a generic industrial skid with a data-center label on it.
Frequently Asked Questions
What TDS level should trigger an alarm on data center cooling make-up water? There’s no universal number — it depends on the cooling technology and the system’s baseline permeate quality. What matters operationally is alarming on deviation from baseline (for example, a documented 15–20 ppm baseline drifting upward) rather than a single fixed threshold borrowed from an unrelated application.
Is conductivity monitoring the same as TDS monitoring? No. Conductivity is measured directly (in μS/cm) and TDS (in ppm) is typically derived from it using a conversion factor specific to the water’s ion composition. Most industrial monitoring setups display both, since a shift in the conversion relationship can itself indicate a change in feedwater chemistry.
Where should the primary alarm sensor be placed — before or after the RO stage? Both matter, but for cold-plate and CDU protection, the permeate-side (post-RO) sensor carries the tighter alarm band, since it reflects what actually reaches the cooling loop. The feed-side sensor is the earlier warning for pretreatment failure.
Can a standard industrial RO skid meet data center reliability requirements? A standard 1–10 t/h skid with five-stage pretreatment and real-time PSI/flow monitoring can meet single-train reliability needs. Meeting N+1 or 2N redundancy requirements for a hyperscale or colocation facility requires engineering multiple trains in parallel — that’s a project-specific design, not a standard SKU.
How does make-up water TDS affect cooling tower cycles of concentration? Lower make-up water TDS raises the ceiling on how many cycles of concentration a cooling tower can run before hitting a scaling or conductivity limit, which is why RO-treated make-up water (versus softened water alone) is increasingly specified on high-density sites focused on water usage effectiveness.
Does cold feedwater affect RO system output? Yes. Membrane flux declines as feedwater temperature drops, so a system’s rated GPD/GPM output at standard test conditions can overstate what it delivers on cold intake water unless that correction is accounted for during sizing.
What’s the difference between single-pass and two-pass RO for this application? Single-pass RO on a 1,300 ppm feed typically lands under 20 ppm TDS in the permeate; a two-pass configuration pushes that below 10 ppm. The choice depends on how tight the cold-plate or CDU loop’s conductivity target actually is — not every application needs the second pass.
Get a Data Center Water Treatment Quote
Feedwater chemistry, rack density, and redundancy requirements are different at every site — the sizing numbers above are a starting point, not a substitute for a site-specific engineering review.
Get an Infrastructure Engineering Quote → Ask About Factory-Direct / B2B Wholesale Pricing
View the Industrial Reverse Osmosis System specifications →