
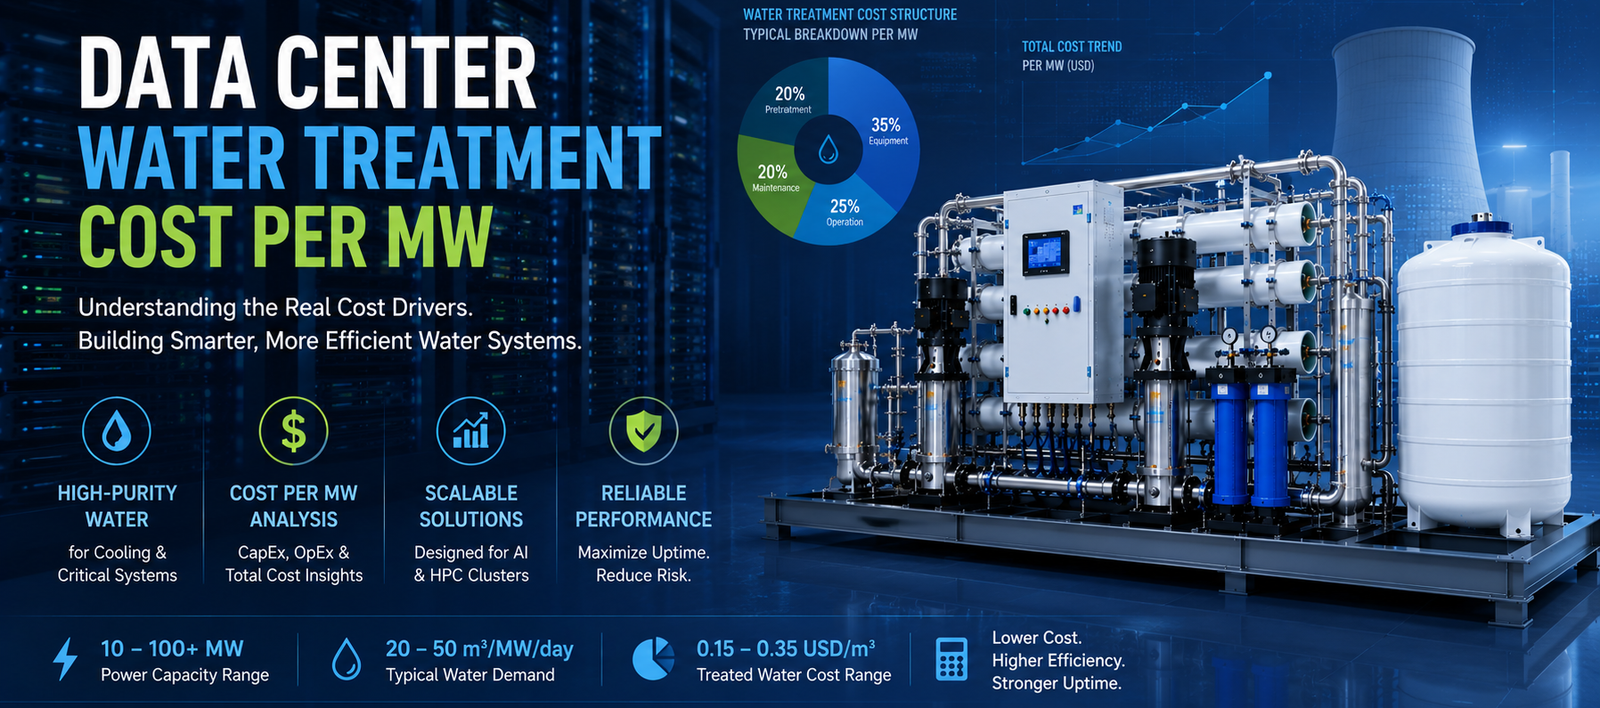
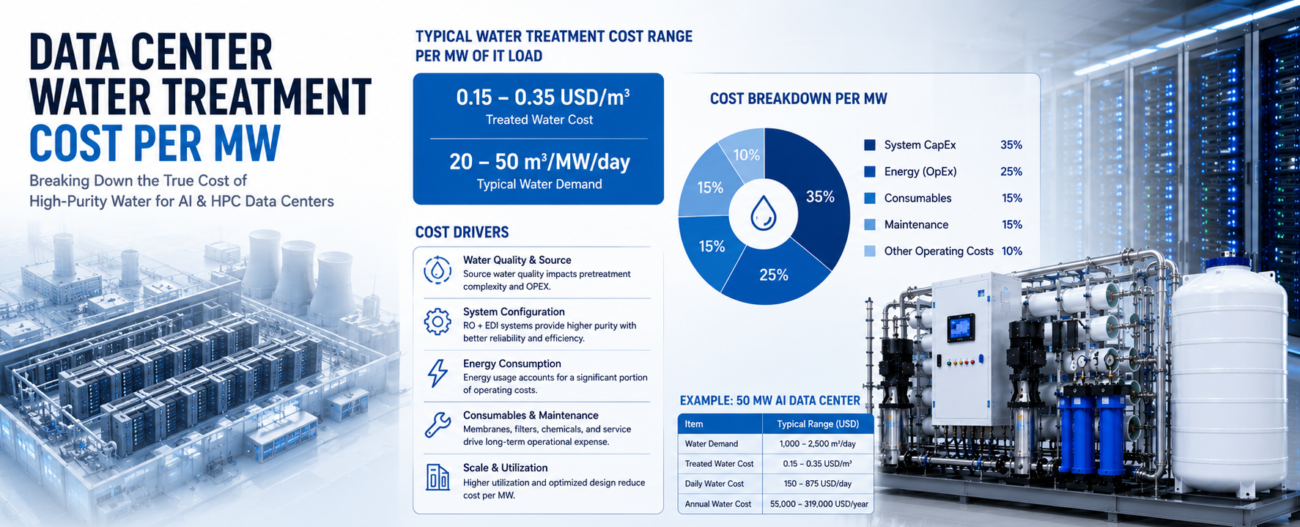
Data Center Water Treatment Cost per MW: Why There’s No Single Number and How to Budget It
There is no universal dollar-per-MW figure for data center water treatment, and applying one facility’s number to another is how a CAPEX budget blows up. The same megawatt of IT load can need almost no water or an enormous amount, depending entirely on how it is cooled.
A per-MW figure feels like a clean planning input. It is also misleading, because the variable that dominates it — cooling architecture — changes the water profile by an order of magnitude before source water and climate are even considered.
Estimating data center water treatment cost per MW correctly means deriving the number from the actual cooling design, not borrowing a figure from a different facility.
Before budgeting a per-MW figure, account for what actually sets it:
- Cooling architecture — air, liquid (direct-to-chip), immersion, or evaporative, the dominant driver.
- Source water — municipal or reclaimed, which changes the treatment train per MW.
- Climate — hot, dry sites lose more water to evaporation per MW.
- Peak versus average load — the plant is sized for peak demand plus N+1, not the average.
- Purity target — ultrapure (low volume, high cost per gallon) versus cooling-tower (high volume).
The sections below break down why the per-MW number moves and how to anchor it.
Fast Check Product: https://yourwatergood.com/product/industrial-reverse-osmosis-system/
There’s No Universal $/MW: Cooling Architecture Sets the Number
The core mistake in estimating data center water treatment cost per MW is treating it as a fixed industry figure. It is not — the cooling architecture sets it, and the spread is enormous.
The same megawatt cools very differently depending on the architecture:
- Direct-to-chip liquid cooling — needs a relatively small volume of ultrapure water (high cost per gallon, low total volume) for the technology loop.
- Evaporative cooling (cooling towers) — needs a large volume of treated makeup water (lower cost per gallon, high total volume and WUE).
- Immersion cooling — uses a dielectric fluid loop with a secondary water loop, a different profile again.
- Air cooling — minimal water, but increasingly unable to handle high-density AI racks.
A direct-to-chip MW and an evaporative-cooled MW have almost nothing in common on the water side — one is a purity problem, the other a volume problem. A single $/MW number averaged across architectures describes none of them, which is why borrowing a figure from a differently-cooled facility produces a budget that is wrong before the project starts.
Why Water Treatment Scales with MW (But Not Directly): The Cooling-Load Link
Water treatment does scale with MW, but through cooling load — not directly. Understanding the link is what makes a per-MW estimate meaningful.
The chain from MW to water treatment:
- IT load (MW) generates heat that must be rejected.
- Cooling load follows from the IT load and the facility’s PUE — the efficiency of getting heat out.
- Water demand follows from the cooling load and the cooling architecture — how much water that heat rejection consumes.
- Treatment size (GPD) follows from the water demand and the source-water quality.
Each link adds a multiplier, and the architecture link is the largest. Two facilities at the same MW with different PUE and different cooling types land at completely different water treatment sizes. MW sets the starting point; the cooling design sets the slope — which is why a credible per-MW estimate is built from the cooling architecture downward, not from a generic ratio.
What Moves the per-MW Number: Source Water, Climate, and Purity
Once cooling architecture is fixed, three further factors move the per-MW number, and ignoring them leaves a budget materially off.
Source water — municipal versus reclaimed:
- Municipal feed needs a lighter train per MW — carbon for chlorine/chloramine and chloride control for 316L — but carries higher ongoing water cost.
- Reclaimed feed needs a heavier train per MW — multimedia, softening, and antiscalant for high TDS and silica above ~150 ppm — but lowers water-purchase cost and may be mandated for WUE.
Climate:
- Hot, dry sites such as Phoenix, AZ lose more water to evaporation per MW than cooler, humid sites, raising both makeup demand and treatment size per MW.
- Climate also drives the peak-versus-average gap, covered in the field insight below.
Purity target:
- Ultrapure direct-to-chip loops at ≤ 10 µS/cm need two-pass RO plus EDI — low volume, high cost per gallon.
- Cooling-tower makeup needs single-pass RO — high volume, lower cost per gallon.
The same MW, treated for two different purities from two different sources in two different climates, produces four very different per-MW numbers. Lock all three before trusting any per-MW figure, consistent with ASHRAE TC 9.9 and EPA frameworks.
Estimating Cost per MW for Early Budgeting: What to Anchor To
Early-stage budgeting often has only the MW figure, not a detailed water spec. A defensible per-MW estimate is still possible — if it is anchored to the right inputs rather than a borrowed ratio.
To build a credible early estimate:
- Start from the cooling architecture — decide air, liquid, immersion, or evaporative before estimating anything.
- Derive peak cooling load from the MW and target PUE.
- Translate to peak water demand (GPD) using the architecture and climate.
- Add redundancy — size to N+1, not a single train.
- Apply the source-water train — municipal or reclaimed pre-treatment.
This produces a per-MW figure grounded in the facility’s actual design rather than a number lifted from a press release. It will still be a range, narrowing as the design firms up. A per-MW estimate is only as good as the cooling and water assumptions under it — which is why the most useful early step is fixing those assumptions, not finding a ratio.
Standard Skids vs Data-Center-Grade Systems: per-MW Capability
The per-MW cost also depends on whether the system is a commercial skid or a data-center-grade plant, because the cheaper option leaves capacity and resilience out of the per-MW figure.
| Engineering Parameter | Standard Pre-Engineered Skids | Data Center Grade High-Redundancy Systems |
|---|---|---|
| Per-MW basis | Average load, single train | Peak load + N+1 redundancy |
| Flow capacity (GPM) | 10–50 GPM | 100–1,000+ GPM, parallel trains |
| Redundancy | Single train | N+1 / N+2 / 2N |
| Purity | 10–20 µm nominal | RO to 0.0001 µm, EDI to 18.2 MΩ·cm |
| Scaling | Fixed unit | Modular per-MW expansion |
| Metering | Basic | Metered makeup/blowdown for WUE per MW |
| BMS integration | Analog (4–20 mA) | Modbus TCP / BACnet IP / SNMP |
| Support | Generic spares | Documented P&ID, standardized spares |
The per-MW basis row is decisive: a skid sized to average load shows a lower per-MW cost that does not hold on the peak day, while a system sized to peak plus N+1 shows the true number. A cheaper per-MW figure that ignores peak and redundancy is not a real per-MW cost.
To pressure-test an estimate, ask whether the per-MW figure is based on peak load and includes redundancy. An average-load, single-train figure understates what the facility actually needs.
Field Engineering Insight: Size to Peak-Day Makeup, Not Average MW
Here is the budgeting trap that catches planners working from a per-MW ratio: the plant must be sized for the peak cooling day, not the average — and a per-MW figure anchored to average load under-sizes and under-budgets the system.
For evaporative cooling, makeup water demand is not constant. It peaks on the hottest, driest day at full IT utilization, and that peak can run well above the annual average. The treatment plant — particularly the RO makeup capacity in GPD — has to meet that peak, because that is the day the loop is under the most thermal stress.
Size the plant on the comfortable average, and on the peak day the system cannot deliver enough treated makeup. The loop concentrates, scaling risk climbs, and hot spots threaten exactly when the facility is working hardest — the worst possible moment for a water shortfall.
So a per-MW number built on average load is structurally too low. The binding figure is peak makeup demand multiplied by redundancy, not the average that makes the budget look smaller.
The defense is to anchor the estimate correctly:
- Base the per-MW figure on peak-day evaporation and makeup at full load, not the annual average.
- Add N+1 redundancy to the installed capacity, not just the base load.
- Size RO and treatment capacity (GPD) to that peak-plus-redundancy figure.
- Account for climate, since hotter, drier sites have a larger peak-to-average gap.
This is the kind of detail that never appears in a borrowed $/MW ratio but decides whether the plant holds on the day it matters most. It is also where correct sizing pays back: a plant sized to peak demand protects cold plates and CDUs when load is highest, avoids the scaling and hot spots of a water shortfall, and holds 99.999% uptime through the worst conditions, not just the average ones.
Data Center Water Treatment Cost per MW FAQs
What is the water treatment cost per MW for a data center? There is no single figure. It depends on cooling architecture (air, liquid, immersion, evaporative), source water, climate, and purity target. A credible per-MW number must be derived from the facility’s actual cooling design, not borrowed from another site.
Why does water treatment cost vary so much per MW? Because cooling architecture dominates. A direct-to-chip MW needs a small volume of ultrapure water; an evaporative-cooled MW needs a large volume of tower makeup. The water profiles — and therefore the costs — are completely different.
How do I estimate water treatment cost for a new build? Start from the cooling architecture and peak cooling load, derive peak makeup water demand (GPD), add N+1 redundancy, and size treatment to that — rather than applying a generic per-MW ratio.
Does climate affect cost per MW? Yes. Hot, dry climates such as Phoenix, AZ lose more water to evaporation per MW than cooler sites, raising makeup demand and treatment size — and widening the peak-to-average gap that governs sizing.
Should I budget on average or peak load? Peak. The plant must handle the hottest-day, full-load demand plus redundancy. Budgeting on average load under-sizes the system and leaves the loop short exactly when thermal risk is highest.
Is reclaimed water cheaper per MW? It lowers water-purchase cost per MW but raises treatment CAPEX and OPEX through heavier pre-treatment. The net depends on local water and discharge pricing and whether reclaimed use is mandated.
Does liquid cooling cost more per MW to treat than air or evaporative cooling? It needs ultrapure water — higher cost per gallon but lower volume — versus the high-volume, lower-cost-per-gallon water of evaporative cooling. The totals differ by architecture, not a simple more-or-less.
Budget per MW From Your Cooling Design, Not a Borrowed Ratio
Data center water treatment cost per MW is not a fixed number — it is set by your cooling architecture, source water, climate, and peak load. The facilities that budget accurately derive the figure from their own design and size to peak demand plus redundancy, not to a ratio lifted from another project.
Whether you are budgeting a single high-density hall or a multi-MW buildout, YourWaterGood sources the right system through our manufacturing partner and a network of vetted factories — data center water treatment cost per MW estimates cover industrial RO, EDI, softening, filtration, and dosing, with quality inspection, logistics, and English-language support handled for you.
- Get an Infrastructure Engineering Quote: send your MW, cooling architecture, and site for a peak-based, configured estimate.
- Request Technical Data Sheets: capacity, recovery, and metering detail to anchor your per-MW budget.
- Get Competitive B2B Pricing: sourced through our supplier network, with QC and shipping managed end to end.