
Water Usage Effectiveness (WUE) for AI Data Centers: RO Recovery Rate and the Sizing Logic Behind the Number

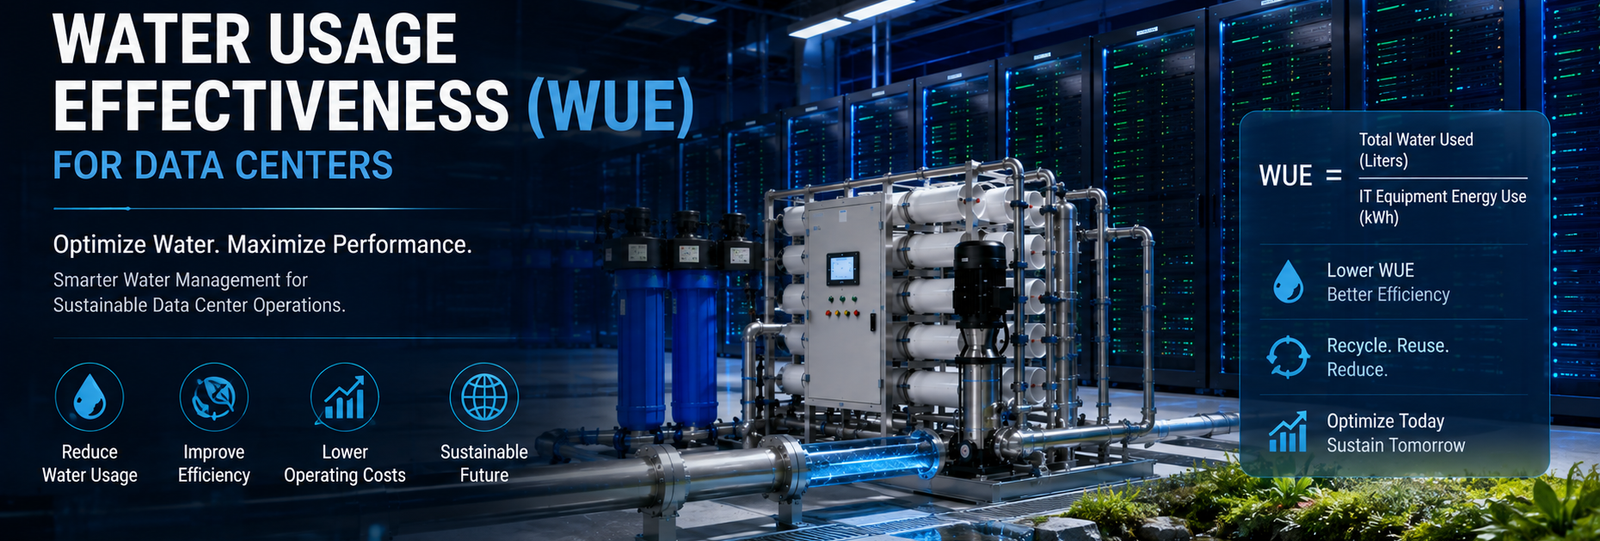
Before a vendor’s “we improve WUE” pitch gets anywhere near your capital plan, pin down these five things:
- A documented RO recovery rate at your actual feed water quality — not a generic “high recovery” claim with no percentage attached
- Modular GPM capacity matched to makeup demand at full rack density, not an average-load estimate that falls apart during peak AI training runs
- A two-stage treatment path (softening + RO) sized to the basin TDS ceiling that unlocks higher cycles of concentration — the lever that actually cuts blowdown volume
- Disclosed reject/concentrate stream volume up front — a WUE improvement that ignores the reject stream is an accounting error, not an engineering result
- Online flow metering on makeup, reject, and blowdown lines, so the annual WUE number can be verified against what’s actually reported alongside PUE
Skip any of these and the WUE figure in the sustainability report won’t hold up against a site water balance audit.
Fast Check Product: https://yourwatergood.com/product/industrial-reverse-osmosis-system/
What Water Usage Effectiveness Actually Measures
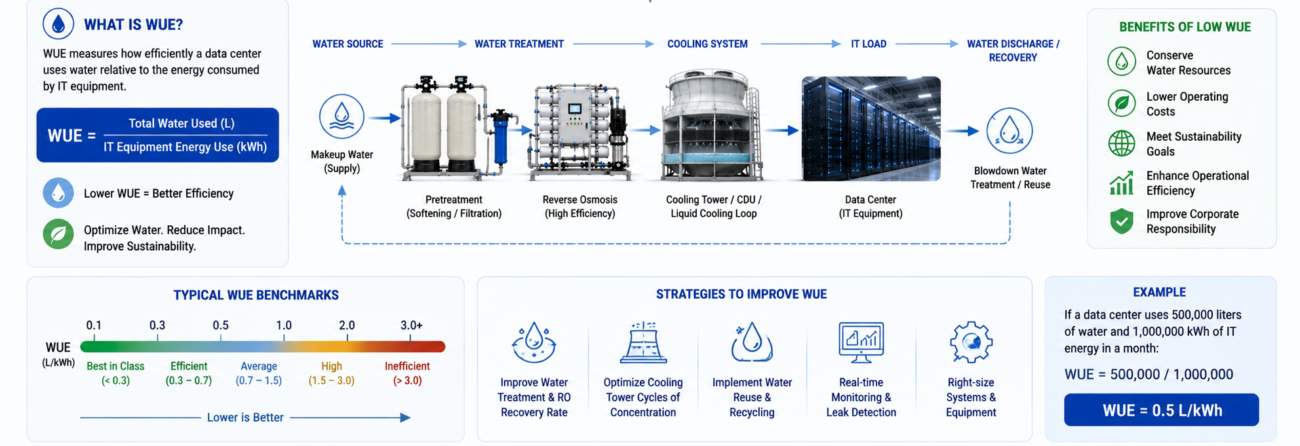
Water Usage Effectiveness compares total site water consumption to total IT energy consumed, expressed in liters per kilowatt-hour. The Green Grid introduced the metric in 2011; ISO/IEC 30134-9 formalized it industry-wide.
Commonly cited averages sit around 1.8–1.9 L/kWh for facilities running conventional evaporative cooling. Efficient hyperscale operators report well under that — global averages near 0.9 L/kWh have been publicly reported, and some closed-loop or air-cooled designs run below 0.25 L/kWh. The spread between those numbers is almost entirely explained by makeup water strategy, not climate alone.
For water usage effectiveness (WUE) for data centers to hold up as a reported metric rather than a marketing number, the makeup water system behind the cooling loop has to be sized and monitored with the same rigor as the mechanical plant itself.
There’s an uptime dimension here too. A site that can’t reliably source enough on-spec makeup water risks emergency dilution or a temporary bypass around treatment — exactly the kind of event that degrades cooling water quality right when a cluster is under peak thermal load.
Where Water Actually Leaves the Site
WUE improvements have to target the right loss path, and a cooling loop has three of them.
Evaporation is the unavoidable one — it’s a direct function of the heat being rejected, and no water treatment change reduces it.
Blowdown is controllable. It’s set by how many cycles of concentration the makeup water quality allows before the basin hits its TDS ceiling, which is exactly the lever a low-TDS RO makeup stream is designed to pull.
RO reject (concentrate) is the third path, and the one most facilities under-optimize. Every gallon of feed water that leaves as reject instead of usable permeate counts against the site’s total water draw, independent of anything happening at the cooling tower.
A WUE improvement program that only targets blowdown while ignoring reject stream volume is solving half the problem.
RO Recovery Rate: The Lever Most Facilities Underuse
Recovery rate is the share of feed water that comes out as usable permeate rather than reject. On a modular platform sized 4.4 to 44 GPM (1–10 t/h), bringing feed water from roughly 1,300 ppm TDS down to under 20 ppm single-stage or under 10 ppm two-stage, recovery rate is a direct design input — set by membrane staging, feed pressure, and pretreatment quality, not a fixed constant.
Two separate mechanisms compound here. A higher recovery rate reduces reject volume for the same permeate output, cutting total feed water draw directly. Lower-TDS permeate simultaneously supports a higher achievable cycle count at the cooling tower, cutting blowdown volume on the back end. Sites that only chase one of the two levers leave real water savings on the table.
Request a Custom Water Balance Assessment to see where your site’s current recovery rate and cycle count sit against what your actual feed water quality supports.
Municipal vs. Reclaimed Water Feed: Different Starting Points for the Same Target
Feed water source changes what recovery rate is realistically achievable, which changes what WUE target is realistic.
Municipal supply carries chlorine or chloramine residual that has to come out ahead of the membrane, and moderate fouling potential that supports a fairly stable recovery rate once pretreatment is dialed in.
Reclaimed or recycled water — increasingly specified to hit aggressive site-level WUE targets — often carries higher organic and silica loading. Left unaddressed, that fouling potential forces operators to run recovery rate down to protect the membrane, which quietly erodes the water savings the reclaimed-water strategy was supposed to deliver in the first place.
The fix isn’t avoiding reclaimed water — it’s pretreatment engineered for it: stronger upstream filtration and softening ahead of the RO stage, sized to hold recovery rate at design point rather than backing it off reactively. Facility water quality targets consistent with ASHRAE TC 9.9 guidance are a reasonable baseline for scoping that pretreatment conversation with your engineering team.
Field Engineering Insight: Why a Strong WUE Number Can Mask a Cold Plate Risk
A site chasing an aggressive WUE target sometimes pushes cycles of concentration up without matching silica control, or stretches softener regeneration intervals to cut salt and water use. Both moves improve the reported number and both raise scaling risk at the exact surfaces that can least afford it — cold plate microchannels running under 100 microns in current-generation accelerator designs.
The other detail that doesn’t show up in a summer commissioning report: RO membrane flux drops as feed temperature falls, so a water usage effectiveness (WUE) for data centers program sized against warm-season feed conditions will under-deliver permeate in winter at the same feed pressure. A WUE target that only holds for nine months of the year isn’t a design basis — it’s a gap waiting for a cold snap to expose it.
Standard Pre-Engineered Skids vs. Data Center–Grade High-Redundancy Systems
| Parameter | Standard Pre-Engineered Skid | Data Center–Grade High-Redundancy System |
|---|---|---|
| Flow control | Fixed GPM band, manual valve trim | Automated GPM trim across parallel trains |
| Redundancy | Single train (N); service requires downtime | N+1 or 2N parallel trains; hot-swap capable |
| Recovery rate monitoring | Manual permeate/reject flow check | Continuous online metering, logged per train |
| BMS / SCADA integration | Local PLC + HMI, standalone alarms | PLC-to-BMS/SCADA handoff, remote alarm escalation, historian logging |
| Delivery lead time | Shorter — standard configuration | Longer — engineered-to-order for site redundancy |
| Filtration precision | 5-stage baseline (multimedia → carbon → softening → security filter → RO) | Same 5-stage baseline, duplexed critical components, tighter alarm bands |
A single-tower retrofit chasing a modest WUE improvement generally fits a standard skid. A hyperscale campus reporting WUE against an ESG commitment, blending municipal and reclaimed sources, tends to need the continuous recovery-rate logging the higher-redundancy configuration carries as standard scope.
FAQ
What is Water Usage Effectiveness (WUE) and how is it measured? WUE compares total site water consumption to total IT energy consumption, expressed in liters per kilowatt-hour; it was introduced by The Green Grid and formalized under ISO/IEC 30134-9.
What’s a good WUE target for a data center cooling tower makeup system? Industry averages commonly cited around 1.8–1.9 L/kWh for evaporative-cooled sites are a starting benchmark; efficient operators with optimized RO recovery and cycles of concentration report well under 1.0 L/kWh.
How does RO recovery rate affect WUE? A higher recovery rate means less feed water leaves as reject for the same permeate output, directly cutting the total water drawn onto site for the same cooling duty.
Does raising cycles of concentration lower WUE? Yes — higher cycles reduce blowdown volume for the same evaporation load, which is one of the two controllable levers behind a lower WUE number, alongside RO recovery rate.
Does reclaimed or recycled water actually help WUE, or just shift the problem? It helps only when pretreatment is sized for its higher fouling and silica load; without that, operators back off recovery rate to protect the membrane and erode the intended water savings.
Can WUE improvements compromise cooling water quality at the cold plate? Yes, if cycles or softener intervals are pushed purely to hit a number without matching silica and hardness control — the scaling risk shows up first at the tightest tolerances in the loop, including cold plate microchannels.
How is annual WUE actually verified once a system is installed? Through continuous flow metering on makeup, reject, and blowdown lines feeding into the annual water and energy totals — a spot-check estimate doesn’t hold up against ISO/IEC 30134-9 reporting rigor.
A WUE number that survives a full four-season cycle — not just a summer commissioning test — starts with real engineering: an Infrastructure Engineering Quote sized to your actual feed water and recovery target, full Technical Data Sheets for your sustainability and mechanical teams, and B2B wholesale / factory-direct pricing on the skid and control package. Request all three before your next WUE target gets committed to a sustainability report.